Key Metrics
500
Users Analyzed
7
Platforms
73m
Avg Daily Usage
Static Output
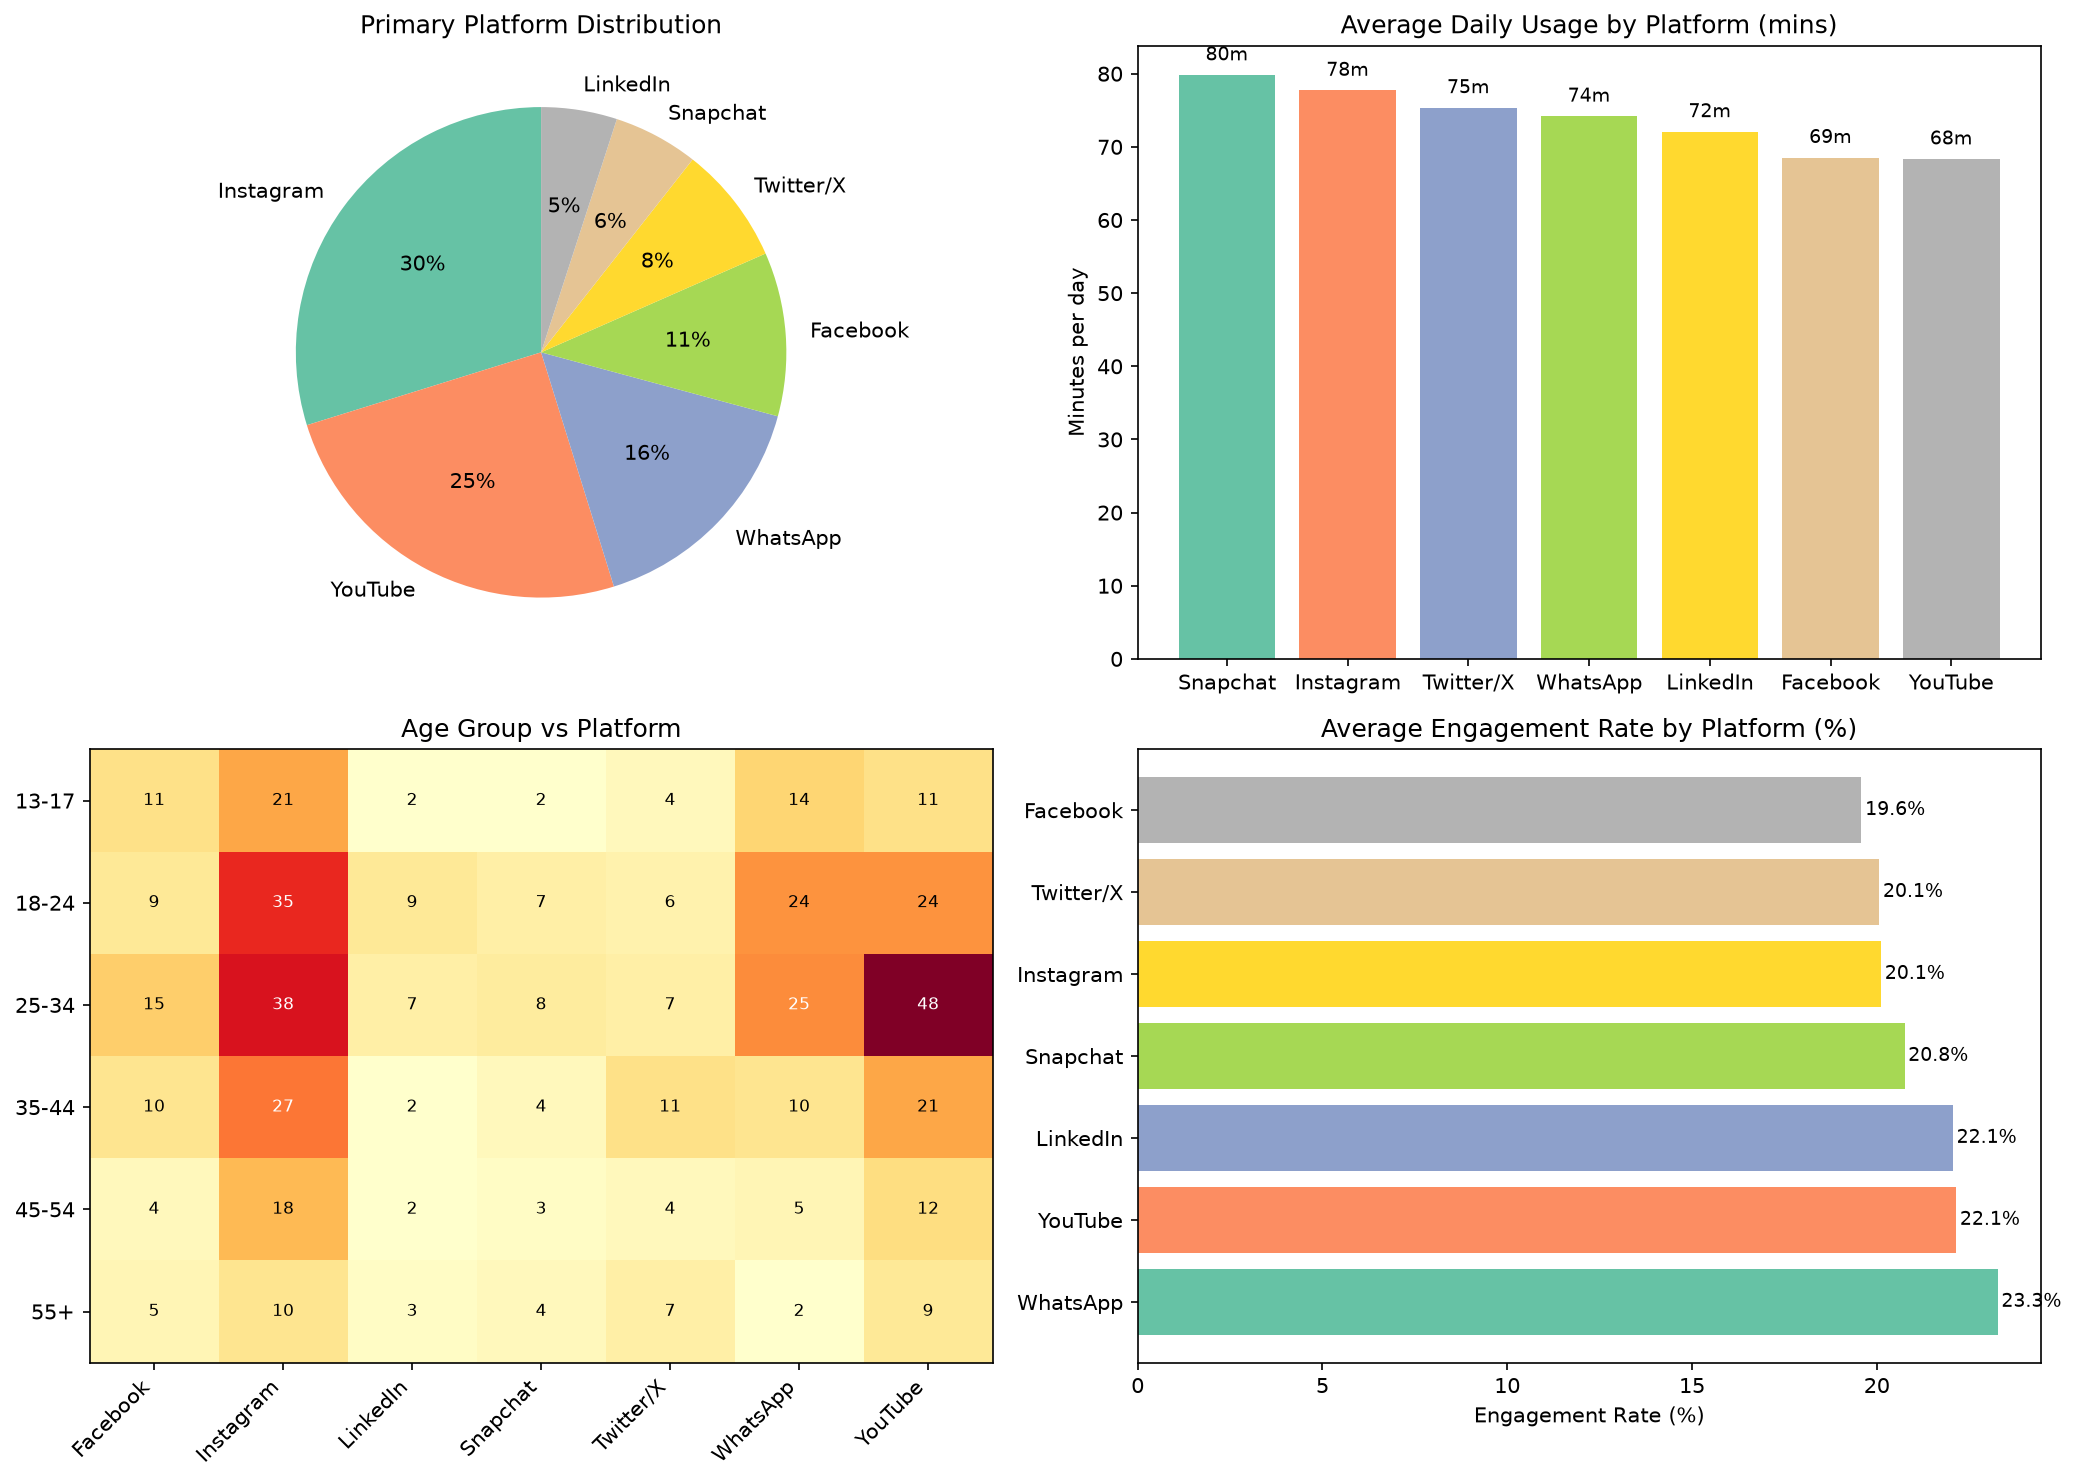
Four-panel visualization: platform distribution, daily usage by platform, age group vs platform heatmap, and engagement rate by platform.
Interactive Chart Try It
Hover over the pie chart for platform shares. Explore the relationship between daily usage and engagement rates.
Top Findings
- Instagram leads market share at 30%, followed by YouTube at 25%.
- 25-34 age group is the most active demographic on social media.
- Average user spends 73 minutes per day on social platforms.
- Snapchat users have highest daily usage (80 min/day on average).
- Instagram has highest engagement rate at 2.1% average.