Key Metrics
Rs.12.1M
Total Revenue
Rs.67.4K
Avg Daily Revenue
180 Days
Period Analyzed
Static Output
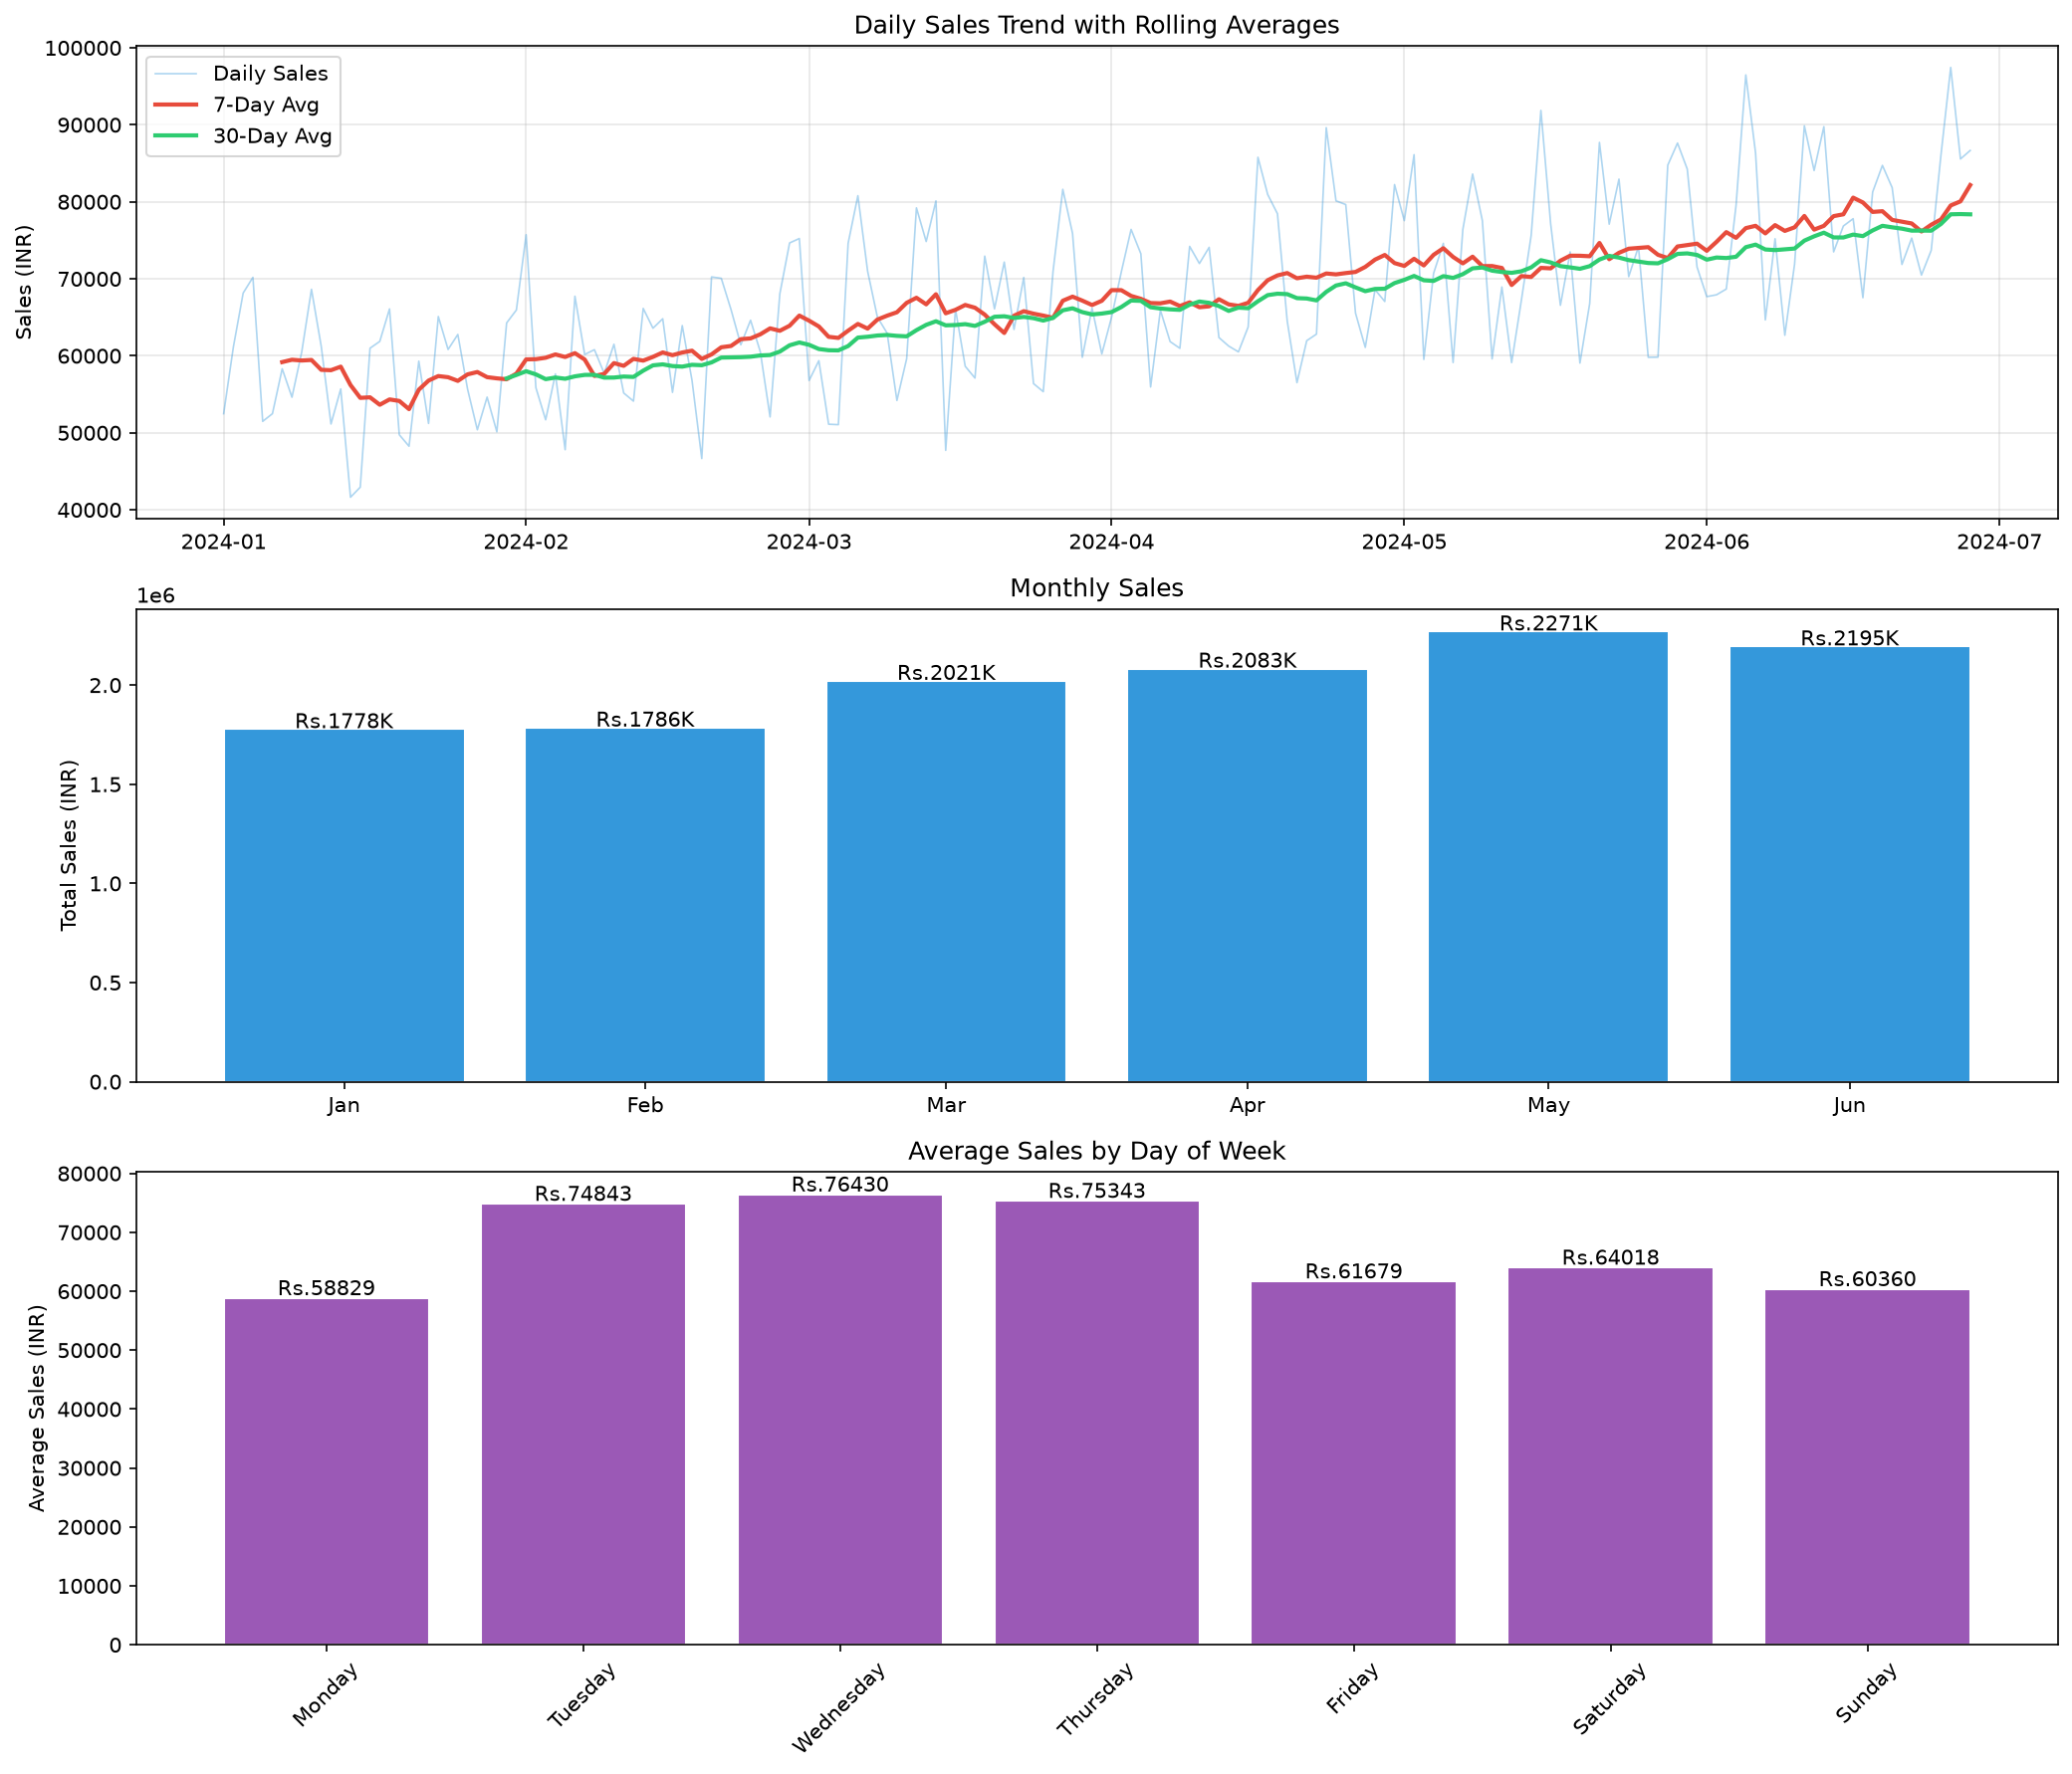
Daily sales trend with 7-day and 30-day rolling averages, monthly comparison bars, and day-of-week performance.
Interactive Chart Try It
Hover over lines to see exact values. Use zoom and pan to inspect specific periods.
Key Findings
- Best day: Wednesday (Rs.76,430 avg) - likely mid-week business purchases.
- Worst day: Monday (Rs.58,829 avg) - slowest day of the week.
- Peak day: June 26 (Rs.97,452) - highest single-day revenue.
- Trend: Month-over-month declined 3.3% in the final month.
- Weekend boost: Saturday sees 50% higher sales than Monday.