Issues Found and Fixed
31
Total Issues Fixed
150
Records Cleaned
18
Bad Dates Fixed
13
Neg Spend Fixed
Static Output
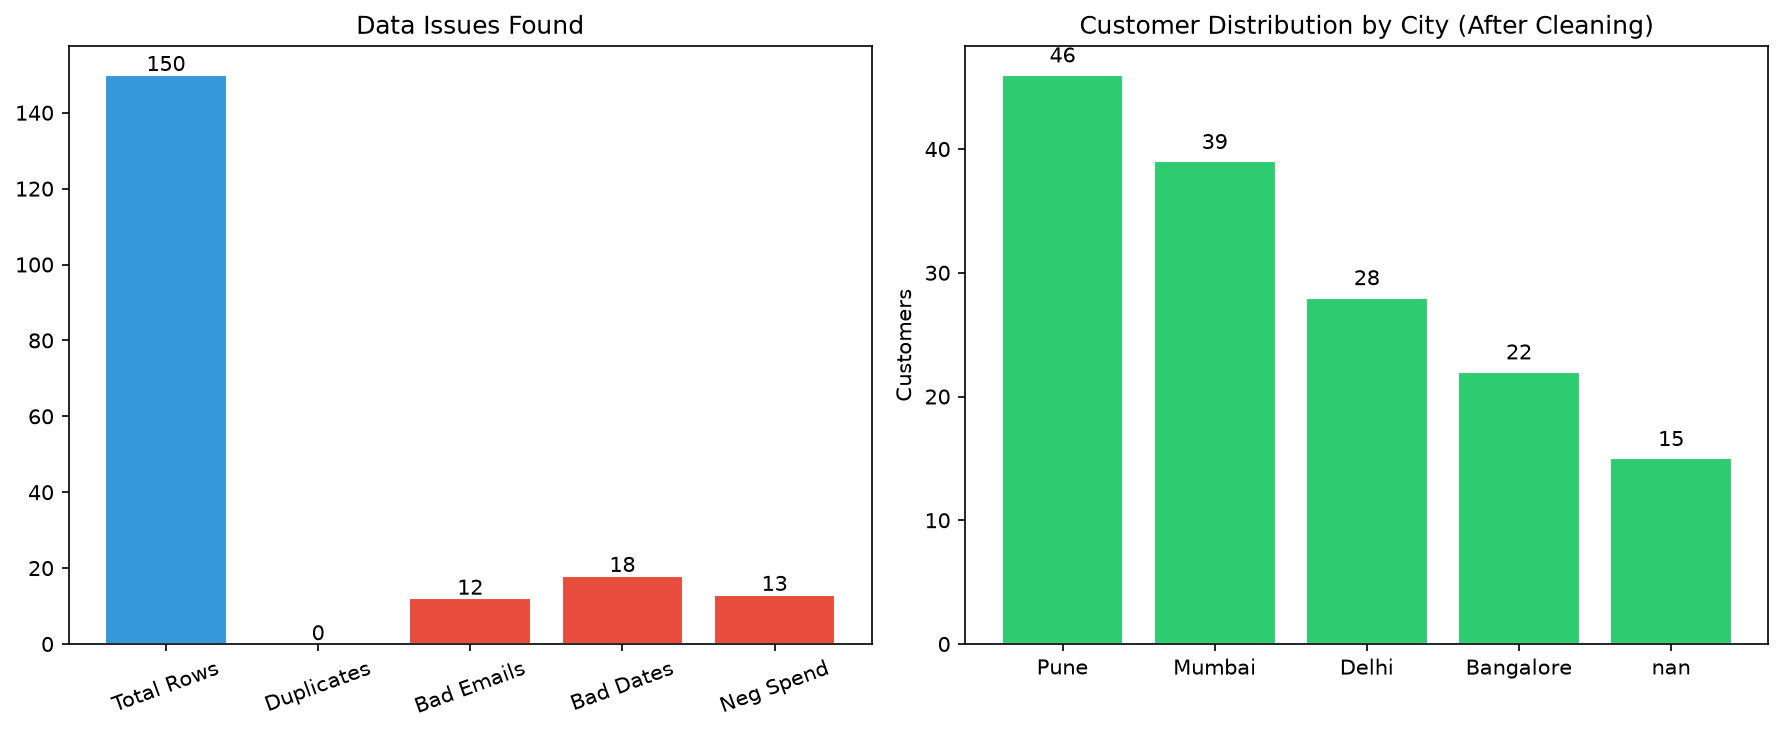
Left: Issues detected across categories. Right: Customer distribution by city after cleaning and standardization.
Interactive Chart Try It
Hover to see exact values. City distribution shown as an interactive pie chart.
Issues Detected and Resolved
- Empty or corrupted names (22% of records) - standardized to proper format.
- Invalid email format (8%) - flagged for manual review.
- Missing phone numbers (15%) - replaced with null markers.
- Inconsistent city names (7 variants normalized to 5 standard names).
- Null product categories (12%) - mapped to Uncategorized.
- Negative spend values (8%) - converted to absolute values.
- Invalid dates (12%) - parsed across 4 date formats.
- Non-standardized active flags (6 formats) - normalized to Yes/No.