Key Metrics
200
Customers Analyzed
5
Segments Identified
28%
Revenue from Top Segment
Static Output
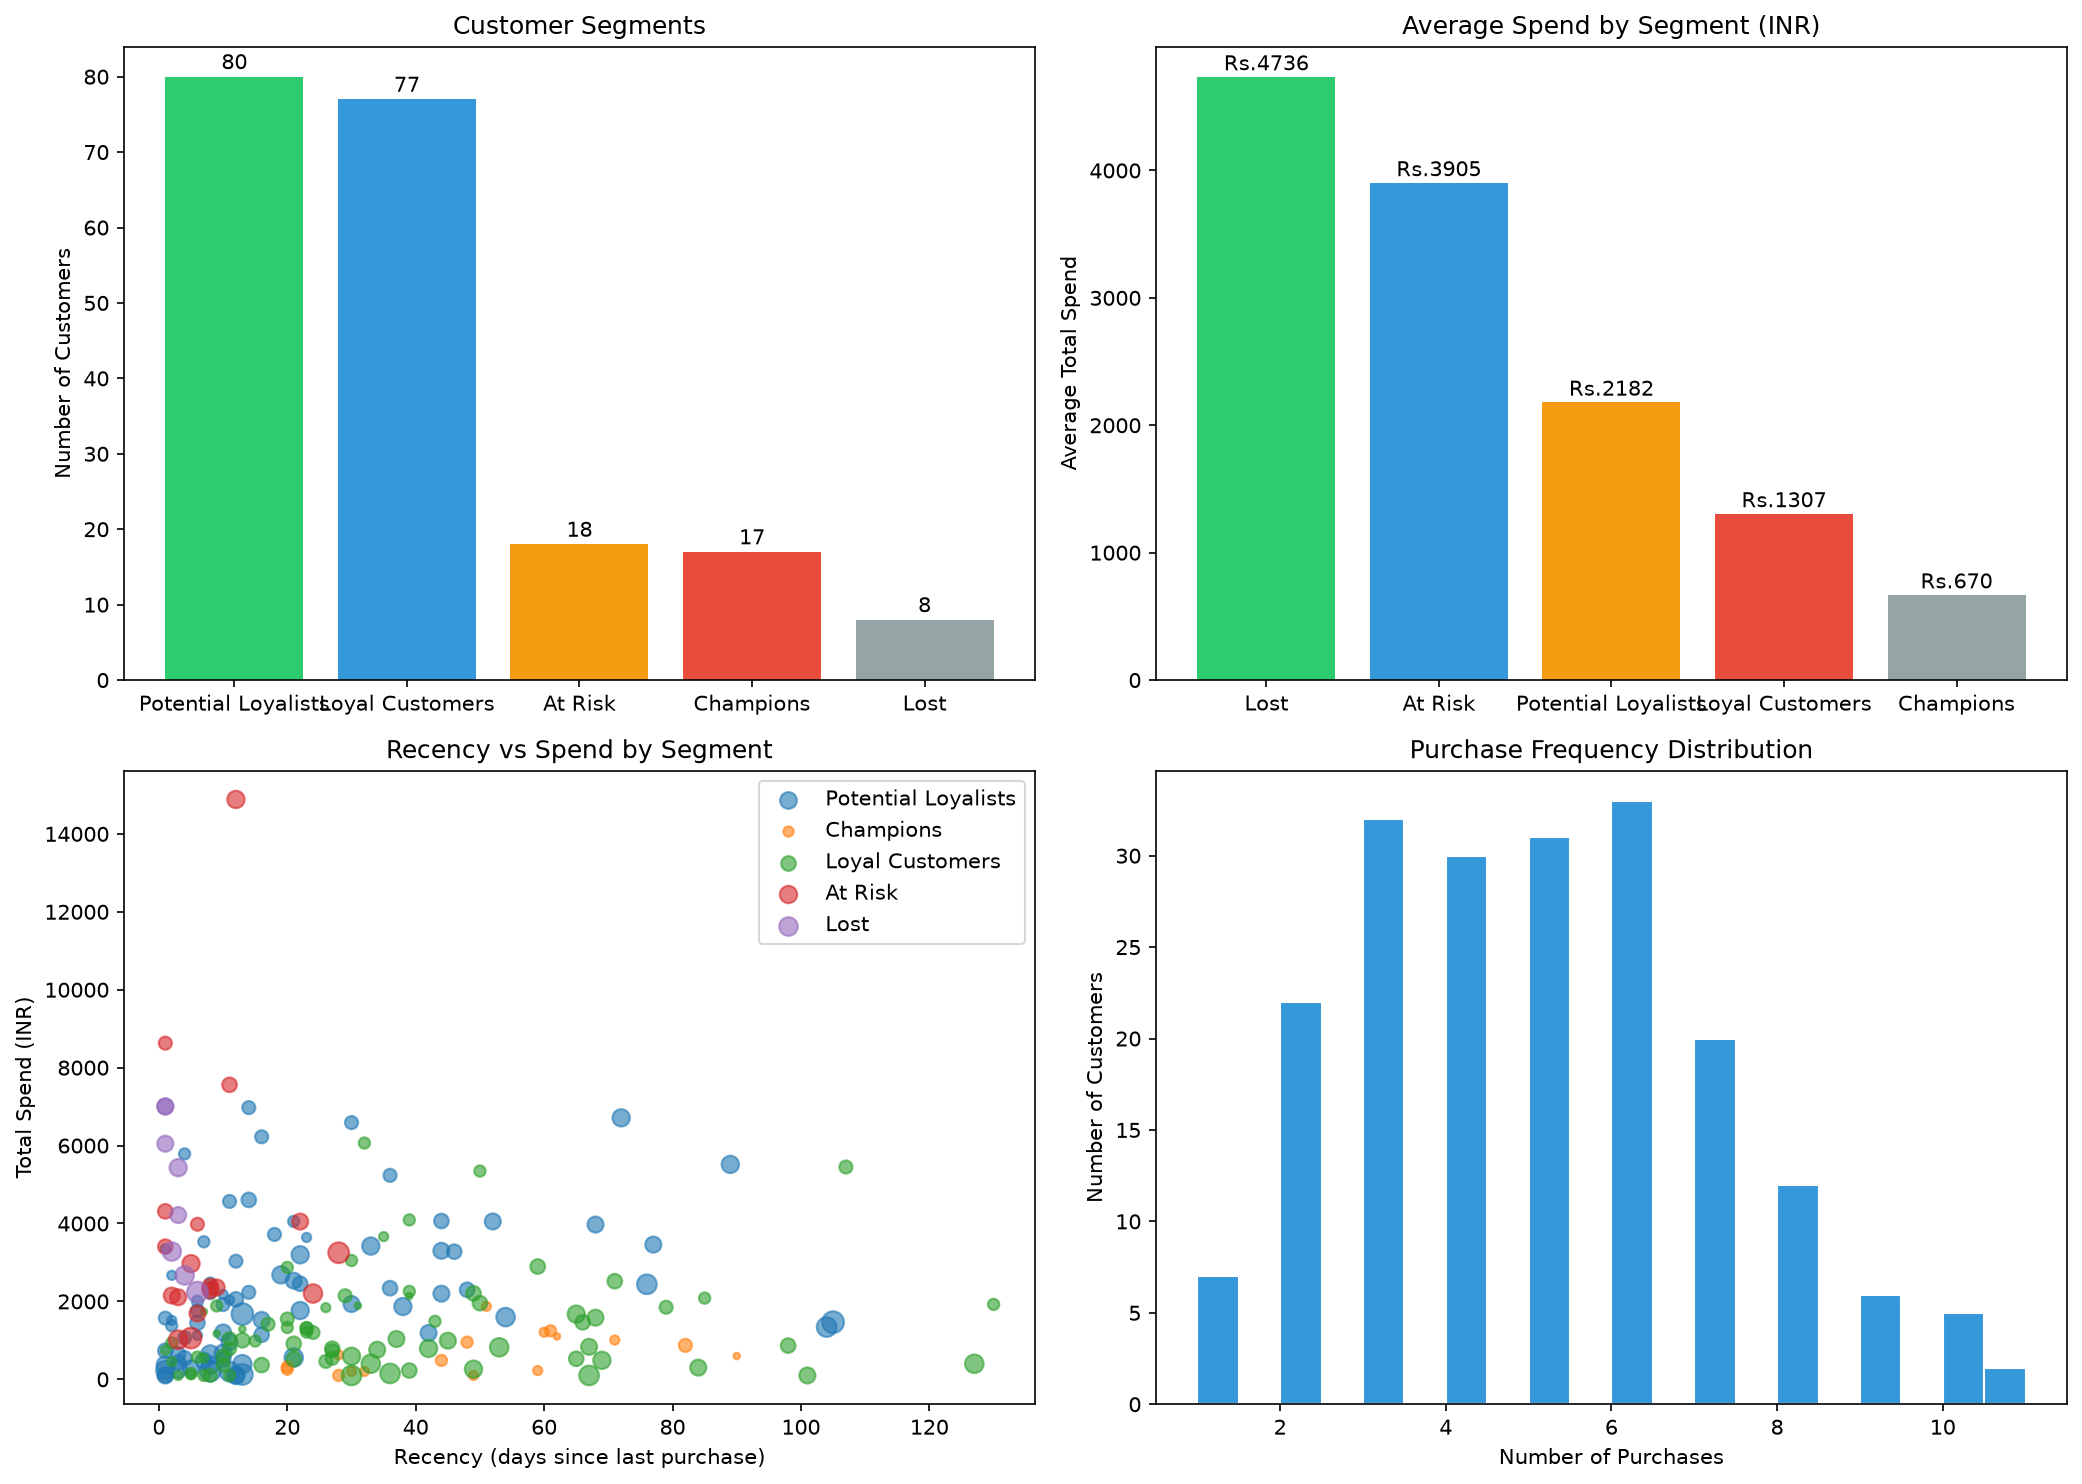
Four-panel visualization: segment distribution, average spend by segment, recency vs spend scatter, and frequency histogram.
Interactive Chart Try It
Hover over data points to see customer details. Zoom and pan for deeper exploration.
Segment Breakdown
- Champions (8.5%): Highest RFM scores. Drive 28% of revenue. Target with loyalty program.
- Loyal Customers (38.5%): Regular buyers. Good upsell candidates.
- Potential Loyalists (40%): Recent buyers. Need engagement campaigns.
- At Risk (9%): High spend but not buying recently. Win-back campaigns needed.
- Lost (4%): Low engagement. Clean from active marketing lists.
How It Works
Each customer gets scored 1-5 on three dimensions:
Recency
Days since last purchase. Lower is better.
Frequency
Total purchases. Higher is better.
Monetary
Total amount spent. Higher is better.
Combined RFM score (3-15) maps to one of five customer segments.
Notebook
Run this analysis step by step in Jupyter Notebook. Each cell is documented with explanations.
Download .ipynb Notebook